Example of delivery driver costs per month

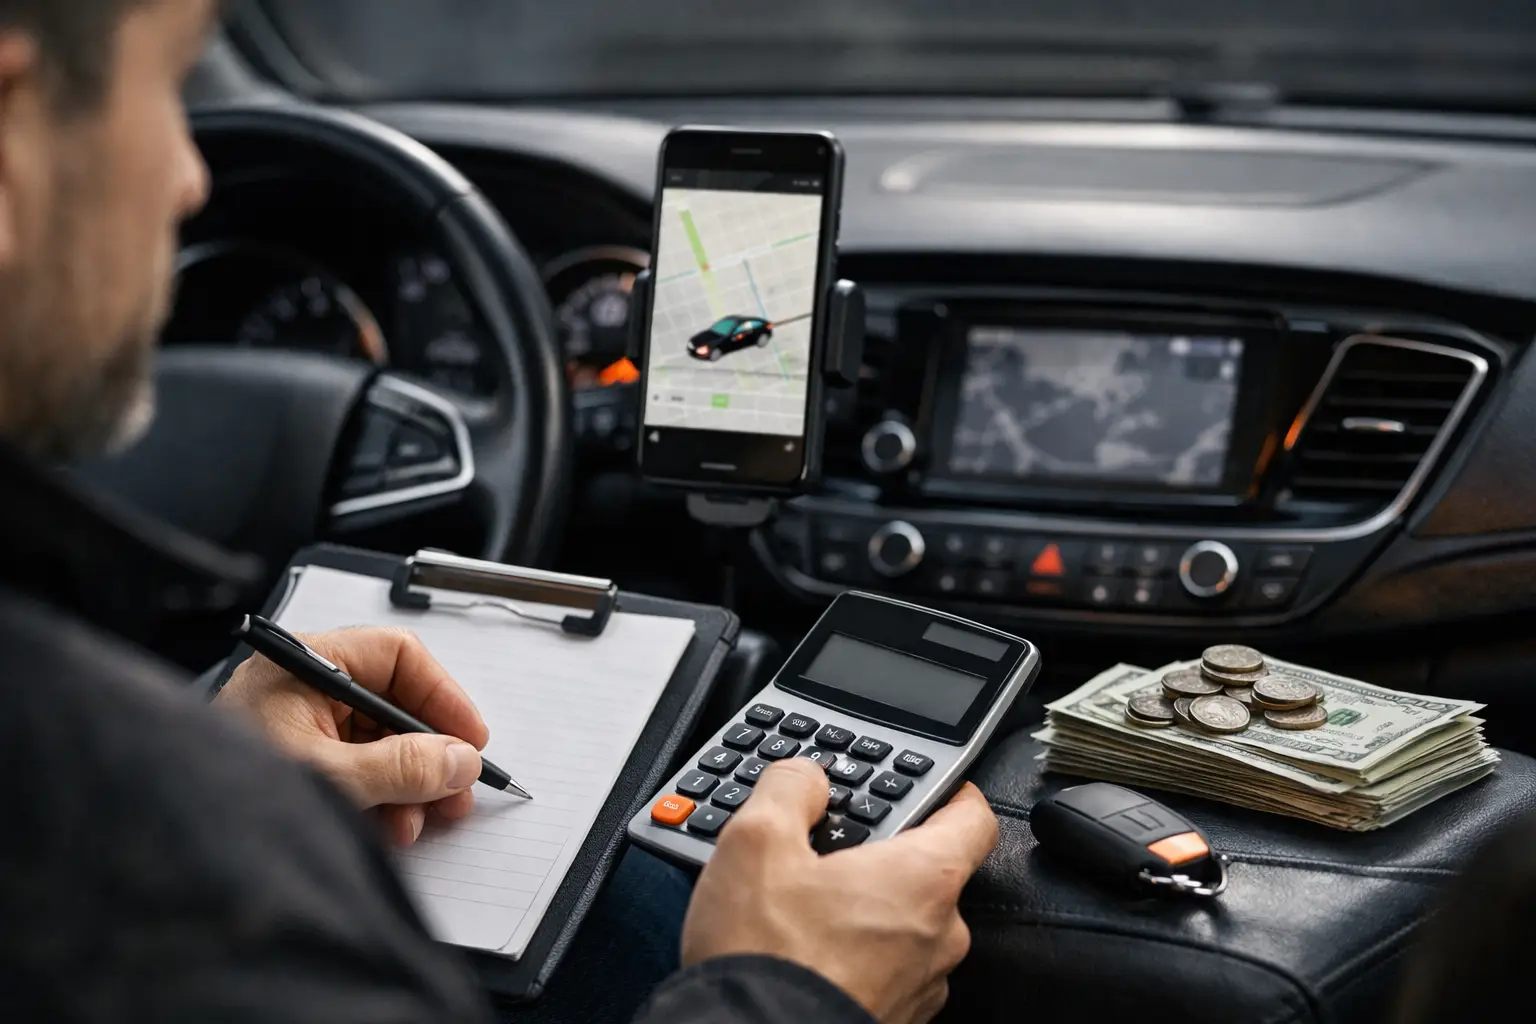
A week with many deliveries can seem great until the end of the month arrives. That's when an example of delivery driver costs makes a difference: the money that came into the app is not the same amount that stays in your pocket. Fuel, maintenance, fees, insurance, and vehicle wear consume a significant part of your earnings, even when they don't all happen on the same day.
For those working in delivery, understanding the cost per kilometer and net profit helps set more realistic goals, choose better time slots, and spot early when your vehicle is demanding more money than it should. This isn't about recording everything for bureaucracy's sake. It's a practical way to know if the work is worth it.
Example of delivery driver costs with a motorcycle
Imagine a delivery driver who uses a 160cc motorcycle to work six days a week. In a month, he rides 3,000 km and receives $4,800 in deliveries, including tips. That's the gross revenue. Now, you need to separate what was spent to generate that income.
Fuel is usually the first cost that comes to mind. If the motorcycle averages 35 km per liter in city traffic, you'll need about 86 liters in the month. With gas at $6.00 per liter, the cost comes to approximately $516.
But the cost doesn't stop at the gas station. Tires, oil, chain, brake pads, and maintenance wear faster when the motorcycle runs many hours with frequent stops and starts. Even if replacement doesn't happen that month, it needs to be factored in. Setting aside a monthly amount prevents scheduled maintenance from becoming a budget surprise.
Here's a simple projection for this scenario:
- Gross revenue: $4,800
- Fuel: $516
- Maintenance and parts (provisioned): $320
- Insurance or vehicle protection: $140
- Oil change and recurring items: $90
- Mobile phone and internet plan for work: $60
- Fees, parking, and miscellaneous expenses: $120
Operational costs total $1,246. The result before taxes comes to $3,554. Dividing by the total of 3,000 km, the operational cost for this motorcycle is about $0.42 per km. This number changes based on fuel consumption, the city, fuel prices, and vehicle condition, but it already gives you concrete ground to track your business.
The most useful part of this calculation is that it shows estimated net profit, not just account movement. If the delivery driver worked 192 hours in the month, the return before taxes was approximately $18.51 per hour. With this reference, it's easier to evaluate whether it's worth accepting certain routes, expanding shifts, or seeking more profitable times and areas.
Delivery driver costs: what many people leave out of the equation
Recording only gas and money received creates an incomplete picture. Small expenses, when added together, reduce your margin significantly. A tire that wears out faster due to rough pavement, a chain that needs adjustment, or brake pads that need early replacement are work costs, not isolated events.
Depreciation also deserves attention. The more your vehicle runs, the lower its resale value tends to be, and the higher the chance of repairs. You don't need to predict every detail of the market to track this. A monthly reserve based on usage already helps protect your cash and prepares you for replacing the vehicle when needed.
Another item that varies a lot is the platform fee. In some models, it's already discounted from the amount transferred to you. In others, there can be incentives, campaigns, and adjustments. The ideal approach is to record what actually hit your account and keep any additional work-related expenses separate. This way, revenue doesn't get inflated by numbers that didn't become available income.
There's also the cost of time spent waiting for deliveries. Waiting for orders, heading to a busier area, driving back home, or dealing with a mechanical problem generates mileage and burns fuel. That's why comparing only the amount paid per delivery can lead to bad decisions. The result needs to account for the complete route and the period worked.
How to calculate cost per kilometer correctly
The basic calculation is straightforward: divide your total expenses for the period by the kilometers driven. If you spent $1,246 and drove 3,000 km, your cost is $0.42 per km. The key is not mixing incomplete data.
Start by noting the odometer at the beginning and end of the month. Then, record each fuel fill-up with the amount, liters, and mileage. This routine shows your vehicle's real consumption, which may differ from the manufacturer's stated consumption. Traffic, cargo weight, incorrect tire pressure, and hard acceleration all change this average.
Next, log maintenance expenses the day they occur and create a forecast for items that have periodic replacement. If a set of tires costs $800 and typically lasts 20,000 km, each kilometer already carries an approximate share of $0.04 of that expense. The same reasoning applies to oil, chain, brakes, and servicing.
You don't need to turn your routine into a complicated spreadsheet. What matters is having a clear category for each expense and recording it while the information is fresh. An app like Mine Garage can centralize fuel fill-ups, services, expenses, and mileage in a vehicle history, making it easier to compare months.
Separating personal and work use improves your analysis
If you use the same motorcycle or car for deliveries, leisure, and family travel, distinguish the routes whenever possible. Otherwise, personal expenses might make delivery seem less profitable than it actually is, or hide a high work cost.
A simple alternative is to record the starting and ending mileage for each shift. By month's end, you'll have an estimate of productive kilometers. If you can't separate all routes, use a reasonable proportion, like 70% for work and 30% for personal use, and review this split regularly.
Does the example change for a car delivery driver?
It does, mainly in cost per kilometer. A car can offer more comfort, cargo capacity, and protection from rain, but usually consumes more fuel and has higher maintenance, tire, insurance, and registration costs. In return, it may allow you to handle larger deliveries, passengers, or additional services, depending on your activity and local rules.
Imagine a driver who runs 4,000 km per month, earns $7,500, and has $1,900 in fuel, $600 reserved for maintenance, $450 for insurance and registration spread monthly, $250 for washing, parking, and mobile phone, plus $500 in estimated depreciation. Costs total $3,700, leaving $3,800 before taxes. In this case, the operational cost is $0.93 per km.
A car isn't automatically a worse choice. The decision depends on the type of delivery, demand in your region, hourly income, the vehicle already available, and the opportunity cost. The mistake is looking only at higher revenue without measuring how much that revenue requires to happen.
Use the numbers to make better decisions
After two or three months of records, patterns begin to emerge. Maybe fuel is rising because the motorcycle lost efficiency. Maybe an area with many short deliveries pays less per hour than another with more predictable distances. Or maybe maintenance costs show that delaying a service turned out to be more expensive than doing it on schedule.
Track at least four indicators: gross revenue, total costs, net profit, and cost per kilometer. If you want to dig deeper, also look at earnings per hour and earnings per working kilometer. They show whether more deliveries are truly adding up to better results.
Set aside a maintenance reserve before spending your profit. Even a small amount saved each week reduces the impact of a flat tire, a service, or an unexpected part replacement. For those who depend on the vehicle to generate income, keeping it ready is part of the job.
The best number isn't the week's highest revenue. It's the amount that still makes sense after paying to run, care for your vehicle, and keep your operation ready for the next day.